
-
 32286 Hits
-
 72.08% Score
-
 2 Votes
|
|
Custom Object |
|---|---|
|
|
40.76820°N / 111.8914°W |
|
|
Interactive Map |
|
|
Salt Lake |
Glitches & Loose Ends
Items Left to Do
- Create dynamic title for each view
- Make cursor change when over interactive summit spheres - any help with this?
- Keep blue bounding box visible when exploring 3D scene (low priority)
Note: This project doesn't seem to be compatible with Mozilla FireFox. I may be able to fix it, but that's really uncertain as to if or when this may be. In the mean time, it definitely works with IE.
Introduction
The Wasatch Mountain Range is a major range in Utah, bordering the Salt Lake City Metropolitan Area, with 5 wilderness areas and many peaks over 10,000 ft in height, rising up to 6,000 ft above the valley floor. I've made a 3D interactive map of this range spanning an area some 130 miles long and 25 miles wide by which SPers can get a sense of the layout of the range and city, as well as easily jump to summits covered on the Summitpost website.
This 3D interactive map is the first in a series that I'm adding to SP as a way to practice my HTML and Javascript Coding, as well as to improve SPer's familiarity with these mountains. SPers can fly over the range to quickly see the relationships of peaks and easily jump to more options such as mountain pages, route overview maps, and an occasional 3D model.
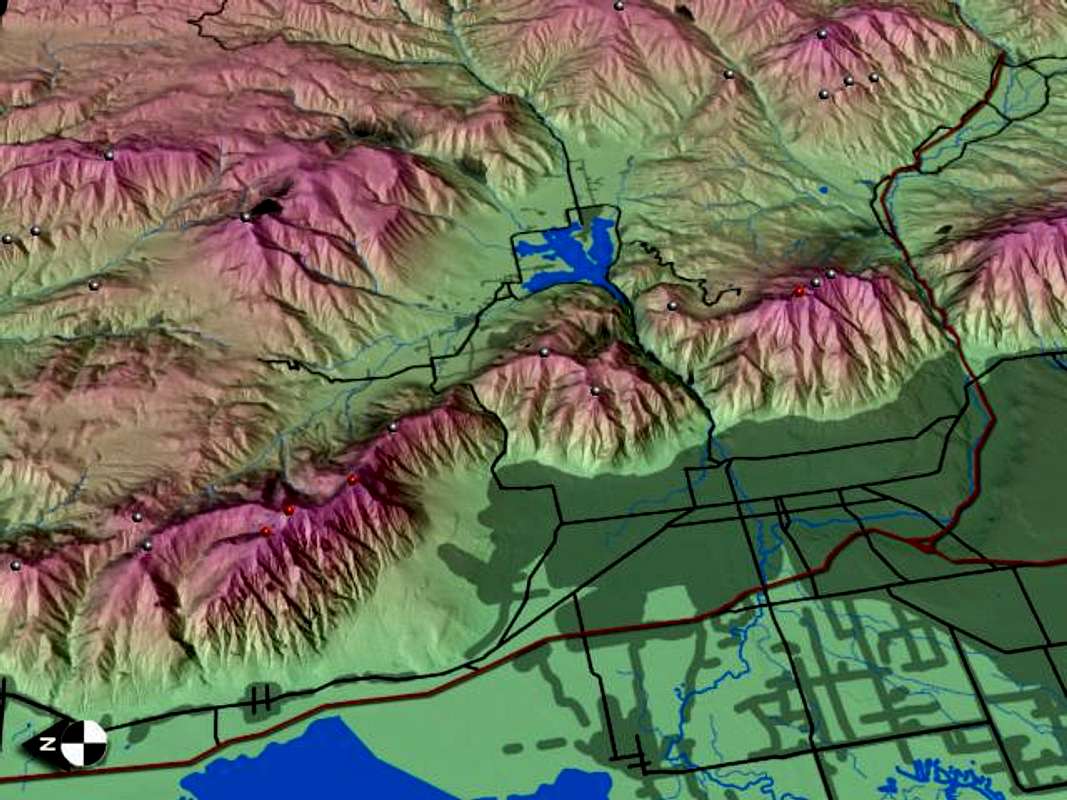
In this regional map I have marked major roadways, rivers, and have displayed the extent of urbanization in the area. In part to increase clarity of the map, and also to help portray heights, the scene is overlayed in what is called IHS (Intensity, Hue, Saturation). This is a color scale that denotes elevation (see IHS key below map).
The benefits of choosing the most appropriate angles and choosing the level of abstraction to emphasize certain details made a computer-generated model more appealing than relying on annotated photographs.
This map will be interlinked with other closeup 3D interactive maps of a few of the summits. The 3D interactive model could be a great way to get a sense of the layout of an entire mountain complex all at once. Not only that, but viewers could also see a fairly realistic representation of what the mountain looks like and the various route lines on the peak.
As these models take a lot of work, I'm limiting myself to mountains where I felt that this method of displaying the peak would be very beneficial as opposed to topo maps and photographs. Future models are likely to cover:
- Broads Fork Twin Peaks Massif
- Lone Peak & Thunder Mountains Massif
- Mt Timpanogos Massif
- Mt Nebo Massif
Unfortunately these will likely not be as photorealistic as the Grandeur Peak scene because I don't have color photos of the area and cannot find free LandSAT coverage - as such, these are likely to be rendered with slightly more textural (but not physical!) abstraction, perhaps using an IHS overlay.
Instructions
Move your mouse cursor over the image to explore.
Navigation Map
Move your cursor over the map navigator on the left of the screen. This will change the 3D view on the right, corresponding to where your cursor is on the map navigator, and a blue higlighted box will show you the approximate area in view.
Labels
Dragging your cursor over unmarked areas of the 3D map may reveal identification of features, first in the browser status bar, and then as a cursor 'tooltip' if you hold the cursor still.
Spheres
Spheres denote summits. Colored spheres are those that have pages on SP, with various colors depending on what options are available. These colored summits are interactive as clicking them will open up a menu with any combination of the following options:
- Visiting the summit's Mountain Page
- Viewing a topographic overview map of all routes for the summit
- Viewing an interactive 3D model of the summit
Keep in mind that the colorless spheres are just named summits - this doesn't necessarily mean that they ought to be on Summitpost. As some of the unlisted peaks are added, I'll update the map.
Currently there is only one 3D Model (of Grandeur Pk), but I may make others (see introduction).
Make sure to close the menu by clicking 'Back' before clicking on another summit.
Wasatch Range 3D Map
|
|
|
 |
||||||||||||||||||||||||||||||||||||||||||||||||||||||||||||||||||||||||

Method
For those who are into GIS (Geographic Information Systems), computer graphics, or are just plain nerdy, the following is a brief 3-part overview of how I created the scene.
| Part 1: Gathering the Pieces Using GIS Software | |
| Indent R | First off, I collected elevation data on a file type known as a DEM (digital elevation model). I was able to gather these for free from GIS Data Depot, which has free DEMS available for every US state except Alaska.
Next I viewed the file in a free-ware GIS program called MicroDEM. Within this program I merged the DEMS and exported a JPEG image of the area shown in IHS. I also exported the area displayed as a grayscale relief image, where lighter colors corresponded to higher elevations. In addition to the IHS & grayscale relief images obtained from DEMs, I also needed topo maps from which to draw roads, routes, etc. and aerial photos to assist in this and possibly use as overlays (i.e. textures) for the scene. I did this using free data from Microsoft Terraserver. Luckily, an earlier SP thread pointed me to USAPhotoMap, a program that easily and automatically downloads and merges all aerial images and topomaps. With this, I created a topo, 1 meter & 8-meter resolution B&W aerial photos, and 4 meter resolution color aerial photos of the entire 130 mile length of the Wasatch Range. |
|
Part 2: Making the 3D Model |
|
| Technically you can make a 3D model straight from DEMs using GIS software, but I found them to be a little crude and hard to customize the appearance and views. To have more control over the scene, I opted to create the scene in a computer modeling and animation program called 3D Studio Max.
Basically, I created a wire mesh box and applied a 'space warp' modifier to it called 'displace'. This displaced vertices vertically based on data from a grayscale relief map. I used the grayscale map created in MicroDEM for this purpose of created the 3D model in Max. As I can only have as many as 200X200 vertices, I made two rows of 8 boxes to increase the resolution detail of the peaks. I could have made the resolution of peak forms and textures greater, but I was already pushing the limits on my computer's abilities. Next I created textures (i.e. overlays) for the model in Adobe Photoshop. For the Wasatch Regional Map I used the IHS image. By temporarily superimposing a topo map (and checking with the more recent aerial photos), I added my own annotations to the map (i.e. lakes, rivers, roads, etc.). This was then applied to the model. For the Grandeur Peak Map I just used the colored aerial photos with the routes drawn in. In 3D Studio Max I created some lighting to help with the look of the scene, and placed 'cameras' in the scene. These allow me to make renderings from a fixed point that I can return to later (helpful for making updates). I rendered the scene as a series of JPEG images, with the scope of the cameras overlapping to get a more seamless transition between views. Finally, I took these renderings into Adobe Photoshop again in order to add the summit sphere markers and north arrow. For the Grandeur Peak scene, I made alternate images, one of which had the routes drawn in Photoshop to make them stand out more. |
|
|
Part 3: Writing the Code |
|
| For me this was the hardest part, as I started out knowing virtually nothing about how to write code. Suffice it to say, I learned a lot of HTML, CSS, and some Javascript to get the scene to work, with a lot of troubleshooting from fellow SPers. I won't go into much detail here on the coding.
In general, I wrote all of the code by hand, with a lot of trial and error. To save my sanity in writing so many HUGE image maps (11 separate maps for this particular model), I used a trial version of CoffeeMap40 and then adjusted its code by hand as I integrated it into my code. And finally, after much time spent keeping busy at 'work', I've finished it! |
|
Granted there are a few odds and ends to take care of, and I'll get to these in due time.
Feedback
I'm still learning HTML, CSS, & Javascript coding as I go. If you have any suggestions for what I can do better in the future for programming or any aspect of visual design or function, please let me know!
Please give feedback or report problems as an 'add info' to this section.
Special Thanks
I'd like to give thanks to the following individuals for helping me on my way to learning HTML, CSS, etc. Their input was invaluable and they were a great resource for ideas, examples, and suggestions on where to look to solve many of the project problems on my own. Thanks a lot, guys!
Image Maps Storage 1-5
Image Maps Storage 6-10